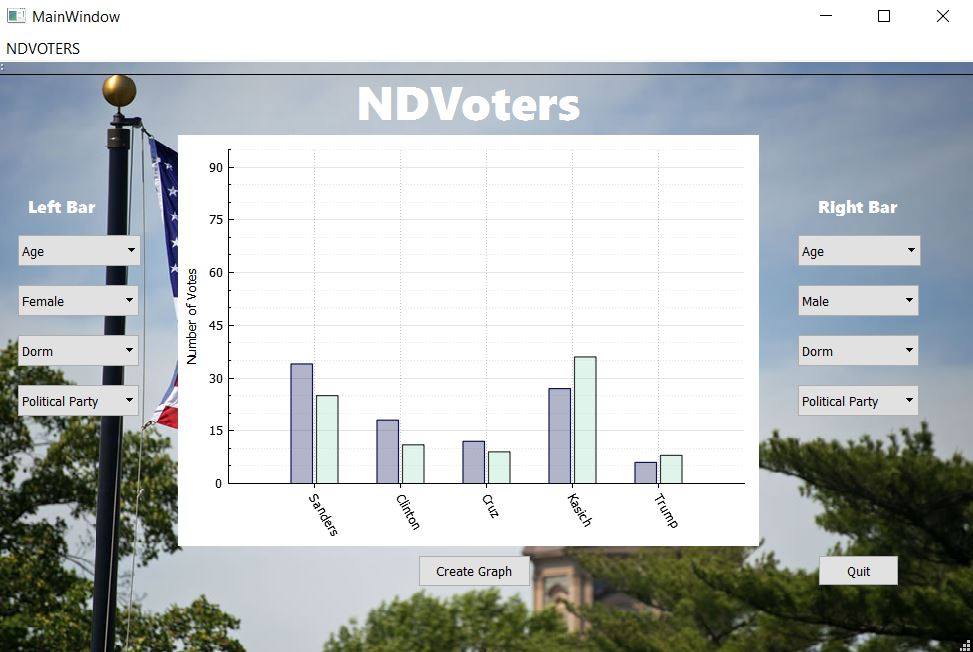
This project, titled NDVoters, was my final project for my Fundamentals of Computing II class in Spring of 2016. My team and I used QT Creator with C++ to generate an interactive GUI that allowed the user to view graphs about the political atmosphere at Notre Dame. Through this project, I learned the necessary skills to combine multiple lessons from the semester (shell scripting, C++ Object-Oriented Programming, and the QT Creator IDE) into one project.
Using a Google form, we polled approximately 200 Notre Dame students on their opinions for the 2016 election. We used the data taken from this poll to create demographic based graphs that allowed the user to interpret the results more thoroughly.
The following description explains how the user navigates through the program. The user is able to view side-by-side graphs about Presidential Primary voting patterns for different demographics. Upon running the program, the GUI opens, initially displaying two side-by-side graphs of the total votes for each candidate. There are drop down menus for each bar of the side-by-side graph. The user can select different drop downs to change the graphs. For example, the user could select “Female” from the gender drop down menu for the left bar, and then select “Male” from the gender drop-down menu for the right bar. After clicking the “Create Graph” button, the user would see a comparison of the voting patterns of each gender. The user can change as many dropdowns as desired to make the graphed voting populations more or less specific. To return to showing the total overall votes for all voters, the user must simply change each dropdown back to the default choice (“Age”, “Gender”, etc.). At any point, the user can press the “Quit” button to close the GUI and exit the program.
